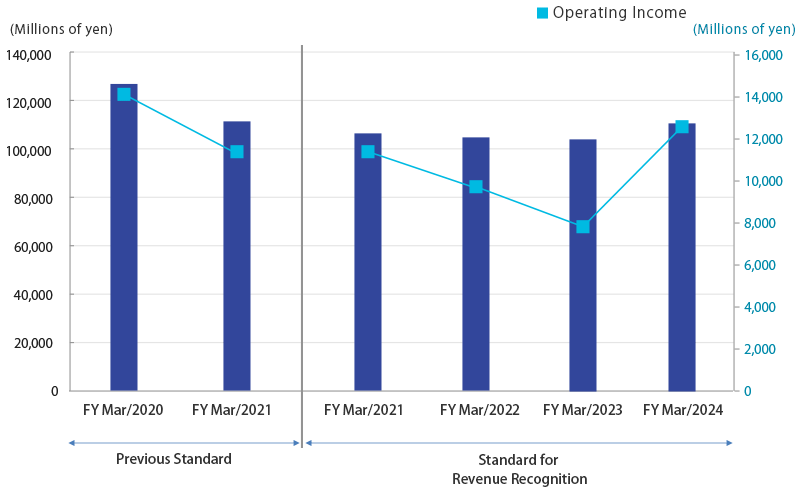
The consolidated financial data
| FY Mar/2020 | FY Mar/2021 | FY Mar/2021 (※After reclassification) |
FY Mar/2022 | FY Mar/2023 | FY Mar/2024 | |
|---|---|---|---|---|---|---|
| Sales (Millions of yen) |
126,810 |
114,909 |
105,146 |
103,992 |
103,595 |
110,881 |
| Operating Income(Millions of yen) |
14,125 |
11,576 |
11,576 |
9,771 |
7,843 |
12,570 |
| Ordinary Income(Millions of yen) |
14,313 |
11,784 |
11,784 |
10,401 |
8,557 |
12,940 |
| Net Income (Millions of yen) |
9,985 |
8,016 |
8,016 |
7,421 |
4,970 |
8,833 |
| ROE |
15.8% |
11.7% |
11.7% |
10.3% |
6.7% |
11.4% |
| Net Income per share(yen) |
83.11 |
66.45 |
66.45 |
61.50 |
41.11 |
73.04 |
| Shareholders equity per share(yen) |
551.99 |
584.73 |
584.73 |
608.51 |
620.72 |
661.38 |
| Dividends per share(yen) |
34 |
34 |
34 |
34 |
34 |
34 |
| Net assets (Millions of yen) |
67,138 |
71,215 |
71,215 |
74,073 |
75,662 |
80,533 |
| Total assets (Millions of yen) |
94,478 |
97,533 |
97,533 |
100,121 |
103,944 |
110,728 |
| Equity ratio |
70.4% |
72.3% |
72.3% |
73.3% |
72.2% |
72.2% |
The "Accounting Standard for Revenue Recognition" has been adopted as of the fiscal year ended March 31, 2022. For reference, the results for the fiscal year ended March 31, 2021, which have been reclassified in accordance with this standard, are also shown below.
Sales・Operating Income
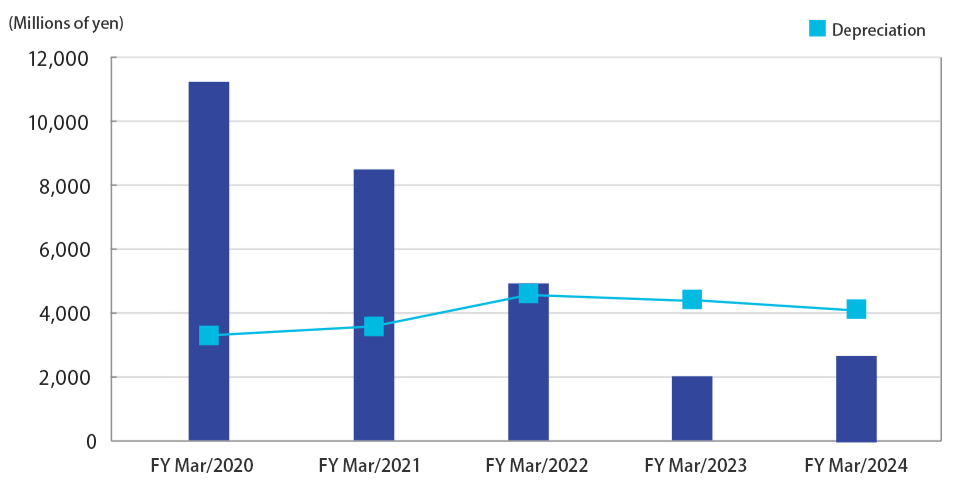
Capital Investment and Depreciation
(Millions of yen)
| FY Mar/2020 | FY Mar/2021 | FY Mar/2022 | FY Mar/2023 | FY Mar/2024 | |
|---|---|---|---|---|---|
| Capital Investment |
11,233 |
8,207 |
5,089 |
2,026 |
2,436 |
| Depreciation |
3,307 |
3,665 |
4,563 |
4,377 |
4,032 |
Capital Investment and Depreciation(Millions of yen)
Sales by Segment
(Millions of yen)
| FY Mar/2020 | FY Mar/2021 | FY Mar/2021 (※After reclassification) |
FY Mar/2022 | FY Mar/2023 | FY Mar/2024 | ||
|---|---|---|---|---|---|---|---|
| Cosme | Online and catalogue |
29,081 |
32,017 |
30,679 |
30,459 |
31,404 |
33,554 |
| Direct store |
29,666 |
18,078 |
13,876 |
13,213 |
11,825 |
12,783 |
|
| Wholesale |
9,096 |
7,726 |
7,513 |
8,339 |
8,800 |
9,179 |
|
| Overseas |
8,047 |
7,317 |
7,151 |
6,797 |
5,417 |
5,689 |
|
| Sub total |
75,891 |
65,140 |
59,221 |
58,809 |
57,448 |
61,206 |
|
| Supple | Online and catalogue |
15,710 |
17,994 |
16,948 |
17,330 |
18,176 |
19,041 |
| Direct store |
12,501 |
8,072 |
6,137 |
6,586 |
5,828 |
7,404 |
|
| Wholesale |
13,176 |
11,989 |
11,633 |
9,898 |
11,541 |
12,514 |
|
| Overseas |
2,617 |
3,134 |
3,134 |
4,655 |
4,325 |
4,761 |
|
| Sub total |
44,006 |
41,191 |
37,854 |
38,471 |
39,871 |
43,723 |
|
| Others | Online and catalogue |
5,104 |
6,801 |
6,443 |
5,112 |
4,736 |
4,536 |
| Direct store |
519 |
500 |
390 |
378 |
389 |
411 |
|
| Wholesale |
1,277 |
1,253 |
1,214 |
1,207 |
1,138 |
993 |
|
| Overseas |
10 |
22 |
22 |
12 |
11 |
10 |
|
| Sub total |
6,911 |
8,578 |
8,071 |
6,710 |
6,276 |
5,952 |
|
| Sub total | Online and catalogue |
49,896 |
56,813 |
54,071 |
52,902 |
54,318 |
57,132 |
| Direct store |
42,687 |
26,650 |
20,404 |
20,179 |
18,043 |
20,599 |
|
| Wholesale |
23,549 |
20,970 |
20,361 |
19,444 |
21,480 |
22,687 |
|
| Overseas |
10,675 |
10,475 |
10,309 |
11,465 |
9,753 |
10,461 |
|
| Sub total |
126,810 |
114,909 |
105,146 |
103,992 |
103,595 |
110,881 |
|
| FY Mar/2020 | FY Mar/2021 | FY Mar/2021 (※After reclassification) |
FY Mar/2022 | FY Mar/2023 | FY Mar/2024 | ||
|---|---|---|---|---|---|---|---|
| Rice | Online and catalogue |
1,018 |
1,132 |
1,064 |
992 |
981 |
956 |
| Direct store |
88 |
63 |
48 |
42 |
36 |
30 |
|
| Wholesale |
923 |
976 |
946 |
1,020 |
967 |
822 |
|
| Overseas |
2 |
0 |
0 |
0 |
0 |
0 |
|
| Sub total |
2,031 |
2,172 |
2,059 |
2,056 |
1,985 |
1,810 |
|
| Kale | Online and catalogue |
1,663 |
1,855 |
1,746 |
1,666 |
1,605 |
1,532 |
| Direct store |
398 |
310 |
235 |
247 |
223 |
213 |
|
| Wholesale |
350 |
274 |
265 |
184 |
166 |
168 |
|
| Overseas |
8 |
22 |
22 |
12 |
10 |
10 |
|
| Sub total |
2,420 |
2,462 |
2,270 |
2,110 |
2,005 |
1,924 |
|
The "Accounting Standard for Revenue Recognition" has been adopted as of the fiscal year ended March 31, 2022. For reference, the results for the fiscal year ended March 31, 2021, which have been reclassified in accordance with this standard, are also shown below.
Segment Information
(Millions of yen)
| FY Mar/2020 | FY Mar/2021 | FY Mar/2021 (※After reclassification) |
FY Mar/2022 | FY Mar/2023 | FY Mar/2024 | ||
|---|---|---|---|---|---|---|---|
| Cosme | Sales |
75,891 |
65,140 |
59,221 |
58,809 |
57,448 |
61,206 |
| Gross Profit |
57,085 |
48,169 |
41,412 |
41,145 |
40,564 |
43,325 |
|
| SGA |
45,316 |
40,215 |
33,458 |
33,563 |
34,659 |
34,859 |
|
Advertising |
8,224 |
6,380 |
6,379 |
7,090 |
8,325 |
7,550 |
|
| Operating Income |
11,768 |
7,954 |
7,954 |
7,581 |
5,905 |
8,466 |
|
| Supple | Sales |
44,006 |
41,191 |
37,854 |
38,471 |
39,871 |
43,723 |
| Gross Profit |
30,397 |
29,085 |
25,300 |
24,925 |
25,717 |
28,178 |
|
| SGA |
26,301 |
24,042 |
20,257 |
21,022 |
22,288 |
22,270 |
|
Advertising |
6,606 |
4,901 |
4,901 |
4,977 |
6,093 |
5,327 |
|
| Operating Income |
4,095 |
5,042 |
5,042 |
3,902 |
3,429 |
5,908 |
|
| Others | Sales |
6,911 |
8,578 |
8,071 |
6,710 |
6,276 |
5,952 |
| Gross Profit |
3,061 |
3,856 |
3,235 |
3,045 |
2,931 |
2,684 |
|
| SGA |
2,970 |
3,631 |
3,011 |
3,071 |
2,838 |
2,969 |
|
Advertising |
572 |
568 |
568 |
509 |
449 |
340 |
|
| Operating Income |
90 |
224 |
224 |
(25) |
92 |
(285) |
|
| Eliminations or Corporate |
(1,829) |
(1,644) |
(1,644) |
(1,687) |
(1,584) |
(1,518) |
|
| Sub total | Sales |
126,810 |
114,909 |
105,146 |
103,992 |
103,595 |
110,881 |
| Gross Profit |
90,543 |
81,110 |
69,948 |
69,116 |
69,213 |
74,189 |
|
| SGA |
76,417 |
69,534 |
58,371 |
59,345 |
61,370 |
61,618 |
|
Advertising |
15,402 |
11,850 |
11,848 |
12,577 |
14,868 |
13,219 |
|
| Operating Income |
14,125 |
11,576 |
11,576 |
9,771 |
7,843 |
12,570 |
|
General and Administrative Expenses
(Millions of yen)
| FY Mar/2020 | FY Mar/2021 | FY Mar/2021 (※After reclassification) |
FY Mar/2022 | FY Mar/2023 | FY Mar/2024 | |
|---|---|---|---|---|---|---|
Advertising |
15,402 |
11,850 |
11,848 |
12,577 |
14,868 |
13,219 |
| Sales Promotions |
14,542 |
15,668 |
8,649 |
7,645 |
6,887 |
7,424 |
| Transport |
5,375 |
5,881 |
5,878 |
5,448 |
5,478 |
5,694 |
| Communications |
1,934 |
1,895 |
1,895 |
1,688 |
1,711 |
1,773 |
| Fees/Outsourcing |
14,018 |
11,584 |
7,513 |
8,297 |
8,525 |
9,607 |
| Salaries |
16,341 |
14,857 |
14,857 |
15,171 |
15,171 |
15,330 |
| Depreciations |
2,062 |
2,160 |
2,160 |
2,611 |
2,612 |
2,320 |
| Others |
6,738 |
5,635 |
5,567 |
5,903 |
6,115 |
6,247 |
| Sub total |
76,417 |
69,534 |
58,371 |
59,345 |
61,370 |
61,618 |
The "Accounting Standard for Revenue Recognition" has been adopted as of the fiscal year ended March 31, 2022.
For reference, the results for the fiscal year ended March 31, 2021, which have been reclassified in accordance with this standard, are also shown below.